Introduction
At work my team and I often deal with quite complex and sizable PROFINET networks. With TIA Portal and PRONETA, we can definitely troubleshoot some network issues. However, if the network issue is intermittent, it will get trickier to troubleshoot. Hence the best way is to set some traces in the PLC that monitor the network components’ status and the suspected causes so we can find some correlations.
So the big question is how do we get the network components’ status?
In this article, I’m introducing a library from SIEMENS that is very powerful in terms of PROFINET diagnosis and manipulations.
The LPNDR Library
The backbone of the LPNDR library is the SIEMENS system function block “read data record” and “write data record”. The LPNDR library has 3 function blocks, the details are below.
| Name | Description |
|---|---|
| LPNDR_ReadGlobalInfo | Read general information about the device. |
| LPNDR_ReadMrpState | Return the status of an MRP domain. |
| LPNDR_ReadWriteParameter | Read and write an ET200SP module parameter record |
In this article, I will focus on LPNDR_ReadGlobalInfo only.
Application Example
Download and Install the Library
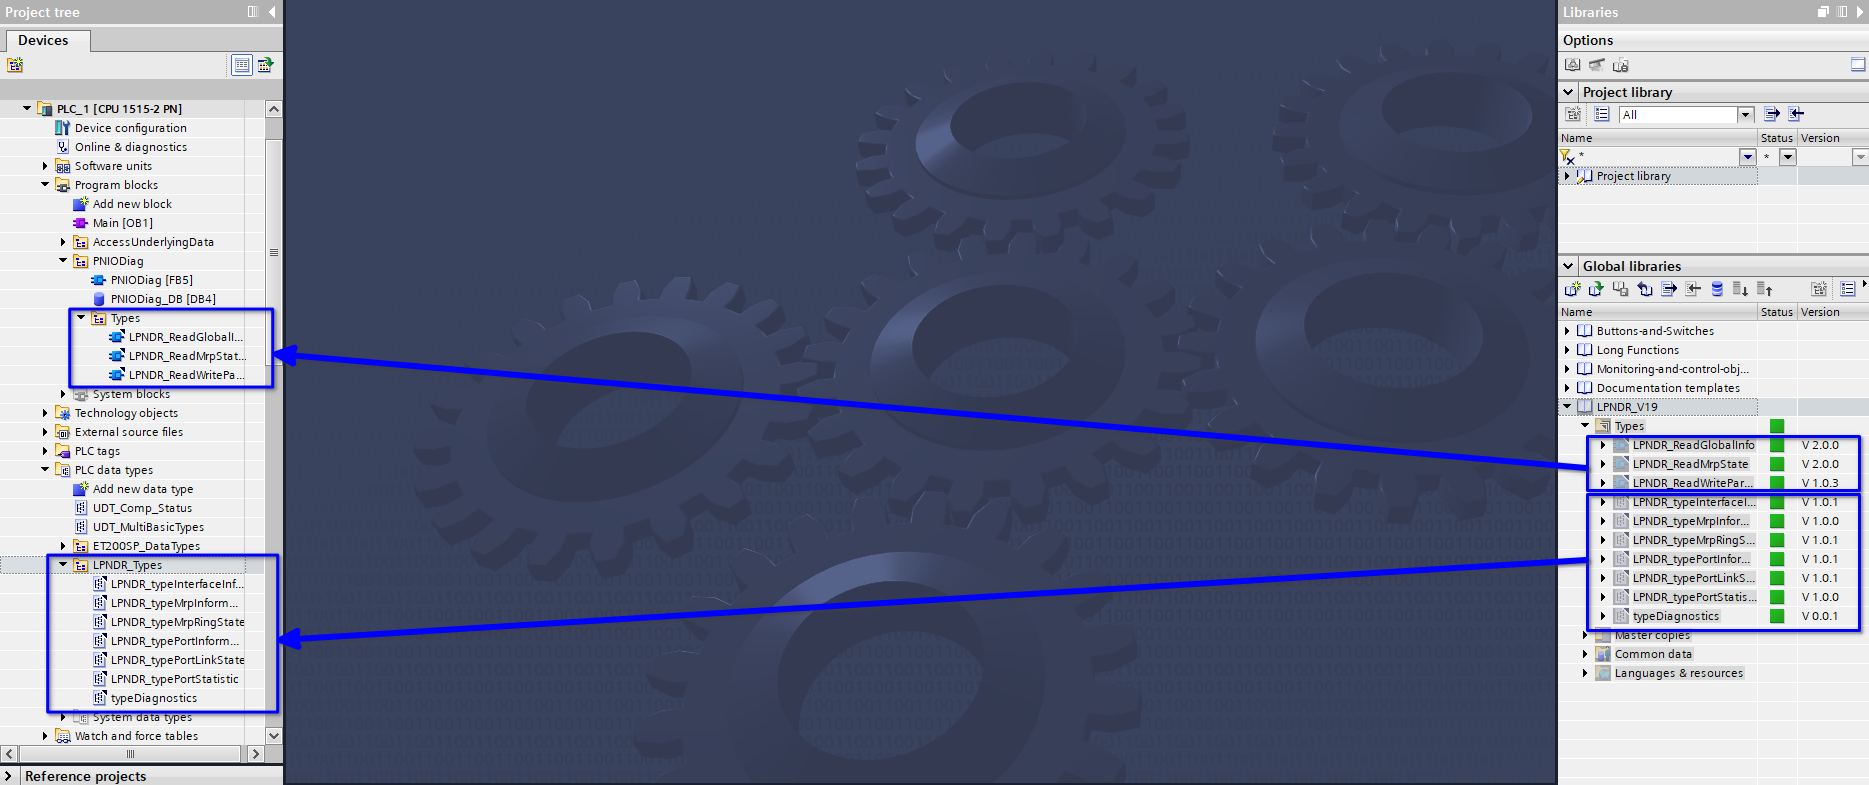
The library is available for download in the SIEMENS support website.
After downloading it, use TIA Portal’s global library feature to open it and copy the typified blocks to your project.
Call the Function Block
The library is extremely easy to use. Simply give it the Hardware ID of the PROFINET device that you want to get the diagnostic information from and It will do the rest.
In the below example, I am calling the function block and manually toggle its instance DB’s execute input to enable the read action.
"LPNDR_ReadGlobalInfo_DB"(hwId := "PN-2151-00-85-A01-170U1~Head");
Read the Diagnosis Information
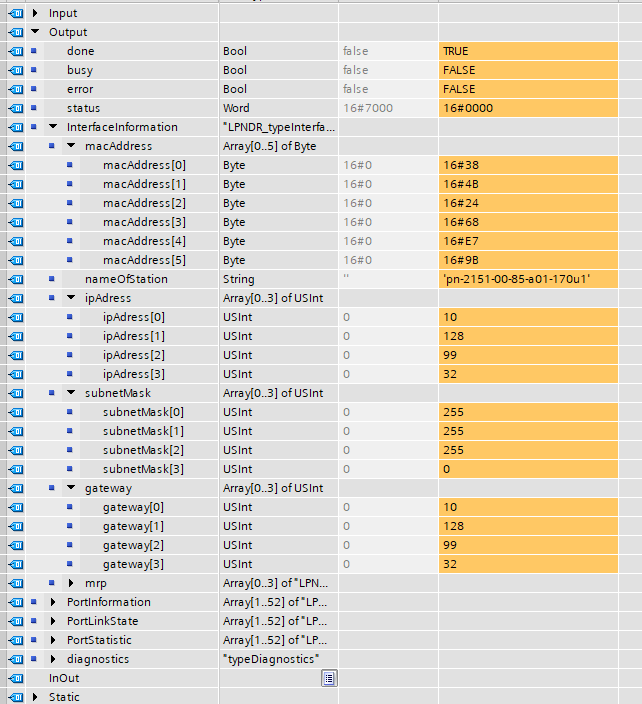
All the diagnostic information is provided in the function block’s outputs. It is surprisingly power full.
In this example, I am reading the diagnostic information of a SCALANCE X switch in my project.
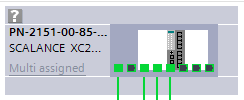
Port 1, 3, 4 and 5 are configured to connect to network devices and the installation is partially finished with port 5’s device not unconnected.
Interface Information
The interface information provides SCALANCE X switch’s configuration in the TIA Portal. In my project, we didn’t use MRP in this switch hence the MRP domain information is empty and I had collapsed it.
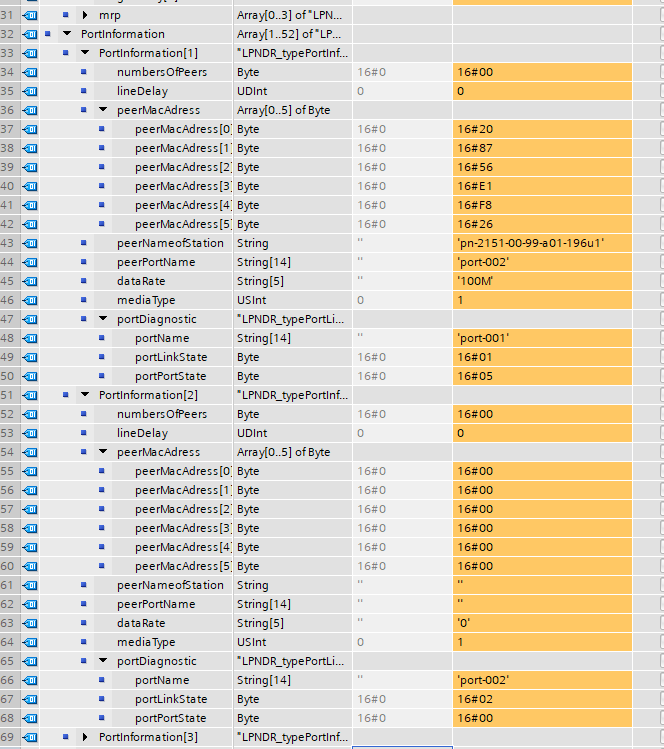
Port Information
The port information is quite useful since it provides the connected peer’s MAC address and device name and connected port number. We can troubleshoot the network connection with this information without using any other software like PRONETA.
Port Link State
The port link state provides information about the device’s ports’ link state and port state.
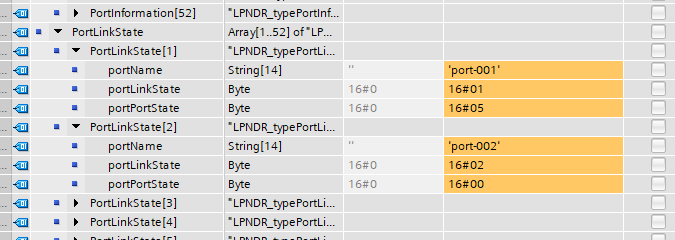
The link state byte can be understood based on the below table.
| Value of PortLinkState | Link Status |
|---|---|
| 1 | Link is up |
| 2 | Link is down |
| 3 | Port is in “testing” status |
| 4 | Link status is unknown |
| 5 | Port is in “demand” mode |
| 6 | Link status is not available |
| 7 | Port status is “LowerLayerDown” |
The port state byte can be understood based on the below table.
| Value of PortportState | Link Status |
|---|---|
| 1 | “Disabled/Discarding” |
| 2 | Blocking |
| 3 | Listening |
| 4 | Learning |
| 5 | Forwarding |
| 6 | Broken |
| 7 | Reserved |
Port Statistics
The port statistics is extremely useful as it provides information about the traffic through the ports.
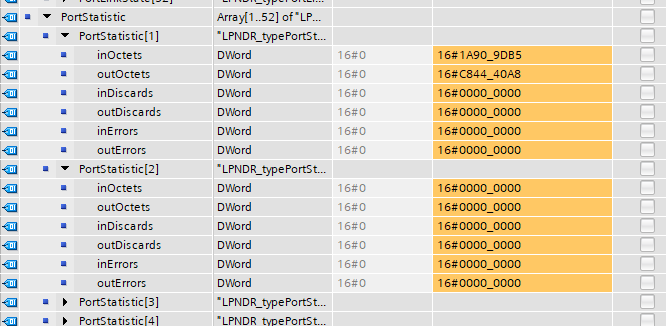
If there is any discard traffic or error traffic, we should pay attention to the port as the network has something wrong.
Conclusion
This article introduces a SIEMENS library to rea3_Ways_to_Break_Down_Tagsd the PROFINET network device diagnostic information and can also perform other tasks. It allows engineers to use PLC user programs to diagnose the PROFINET network without relying on software like PRONETA, etc. This library is very useful in both network diagnosis and making a simple service tool for projects in production.